Financial Highlights
- Strong Recorded Music Subscription Streaming Growth Underpinned by a Robust Slate and Healthy Industry Trends
- Continued Momentum in Music Publishing Led by Strength in Digital and Performance
- Strong Margin Expansion and Double-Digit Growth in Operating and Free Cash Flow Reflect Solid Underlying Performance and Disciplined Cost Management
- Reiterating Full-Year Operating Cash Flow Conversion Guidance of 50-60%
For the three months ended June 30, 2024
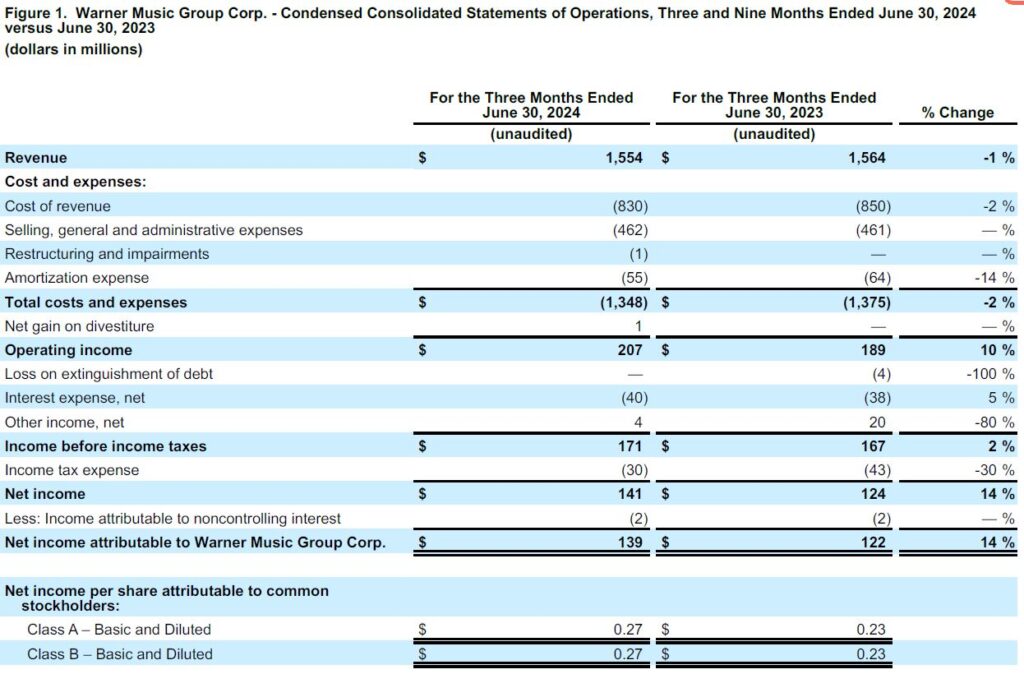
- Total revenue decreased 1%, or increased 1% in constant currency
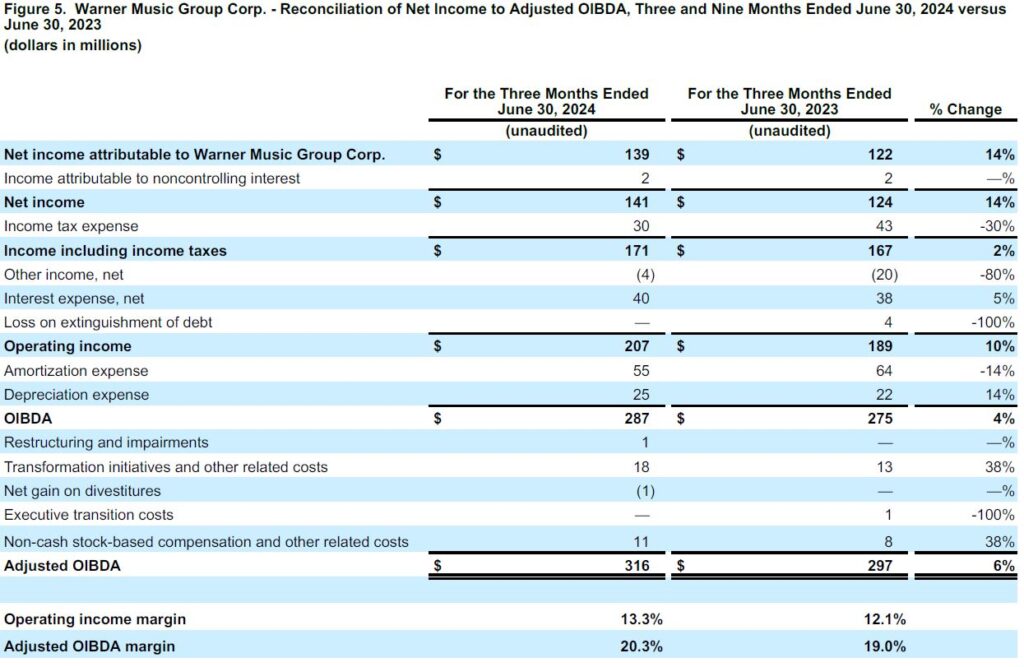
- Net income increased 14% to $141 million versus $124 million in the prior-year quarter
- Operating income increased 10% to $207 million versus $189 million in the prior-year quarter
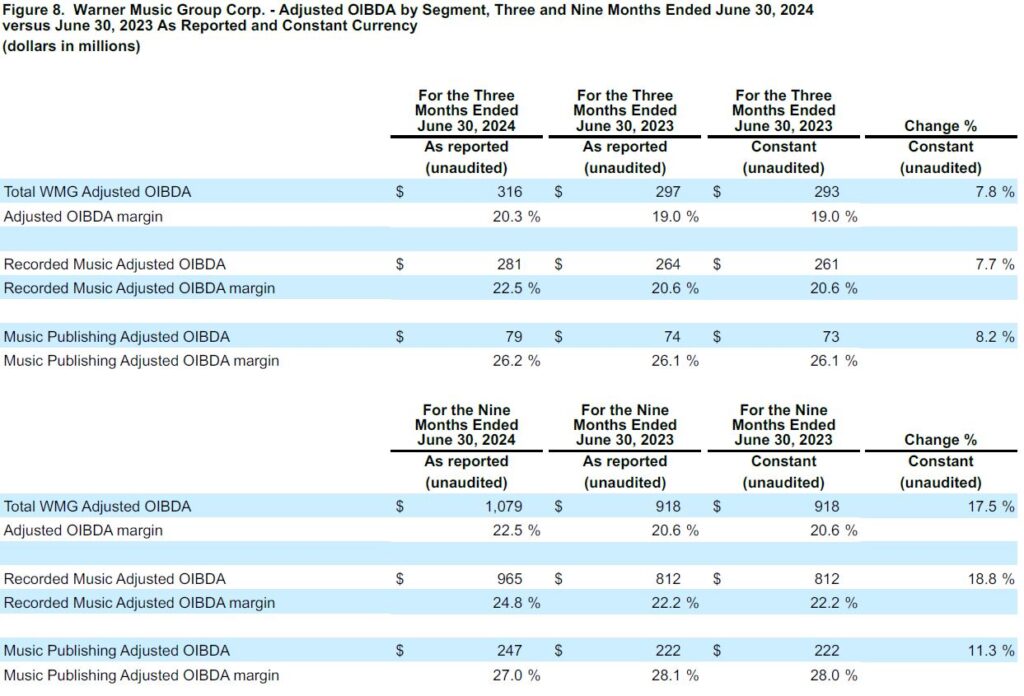
- Adjusted OIBDA increased 6% to $316 million, versus $297 million in the prior-year quarter, or 8% in constant currency
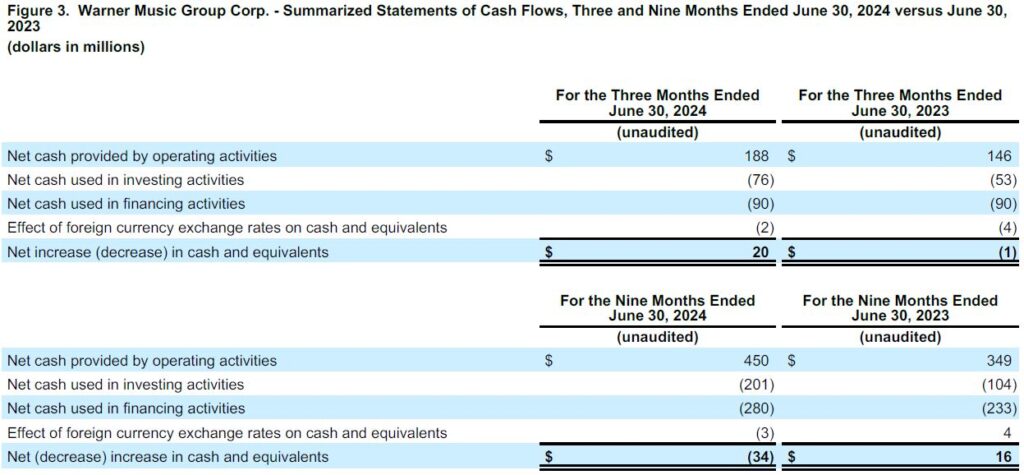
- Cash provided by operating activities increased to $188 million, versus $146 million in the prior-year quarter
NEW YORK, New York, August 7, 2024—Warner Music Group Corp. today announced its third-quarter financial results for the period ended June 30, 2024.
“Our strong subscription streaming growth in Q3 was driven by the performance of our music and healthy industry trends,” said Robert Kyncl, CEO of Warner Music Group. “We’re nurturing the next generation of artists and songwriters, creating fresh impact for our iconic catalog, and working with our partners to increase the value of music. Our commitment to long-term artist development, combined with a flatter structure in recorded music, will enable us to super-serve talent and set WMG up for sustained future growth.”
“Our Q3 results were highlighted by strong margin expansion and operating cash flow growth, reflecting robust streaming performance and disciplined cost management,” said Bryan Castellani, CFO, Warner Music Group. “Looking ahead, we are focused on delivering a strong close to the year. The industry remains healthy and we continue to position ourselves for long-term success.”
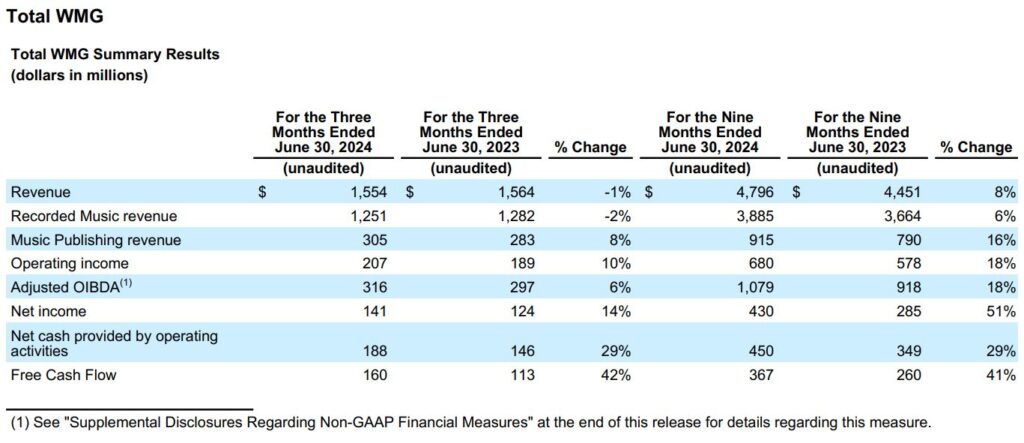
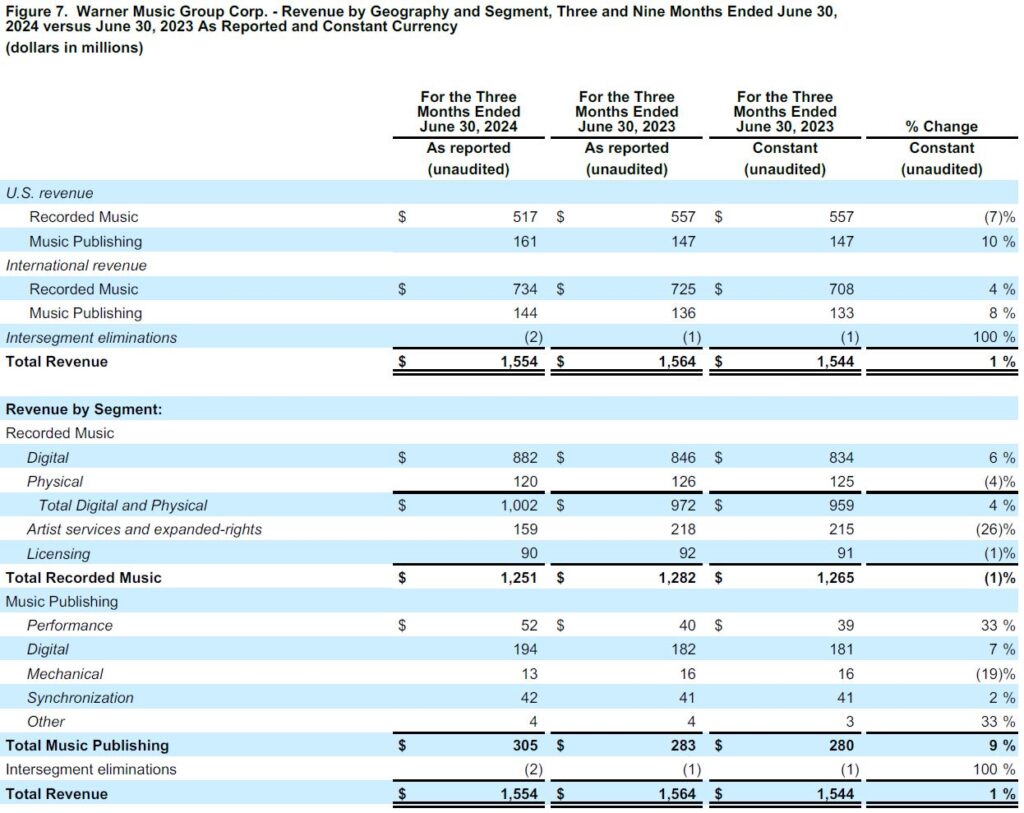
Revenue was down 0.6% (or up 0.6% in constant currency). Consistent with the prior quarter, Recorded Music digital revenue growth was unfavorably impacted by the termination of the distribution agreement with BMG (the “BMG Termination”), which resulted in $26 million less revenue compared to the prior-year quarter, and a renewal with one of the Company’s digital partners (the “Digital License Renewal”), which resulted in a $3 million unfavorable impact within Recorded Music streaming revenue compared to the prior year quarter. Music Publishing digital revenue growth was unfavorably impacted by a $7 million benefit in the prior-year quarter due to a ruling by the Copyright Royalty Board in Phonorecords III upholding higher percentage of revenue U.S. mechanical royalty rates (the “CRB Rate Benefit”). Excluding the BMG Termination, the Digital License Renewal, and the CRB Rate Benefit, total revenue was up 1.7% (or 3.1% in constant currency).
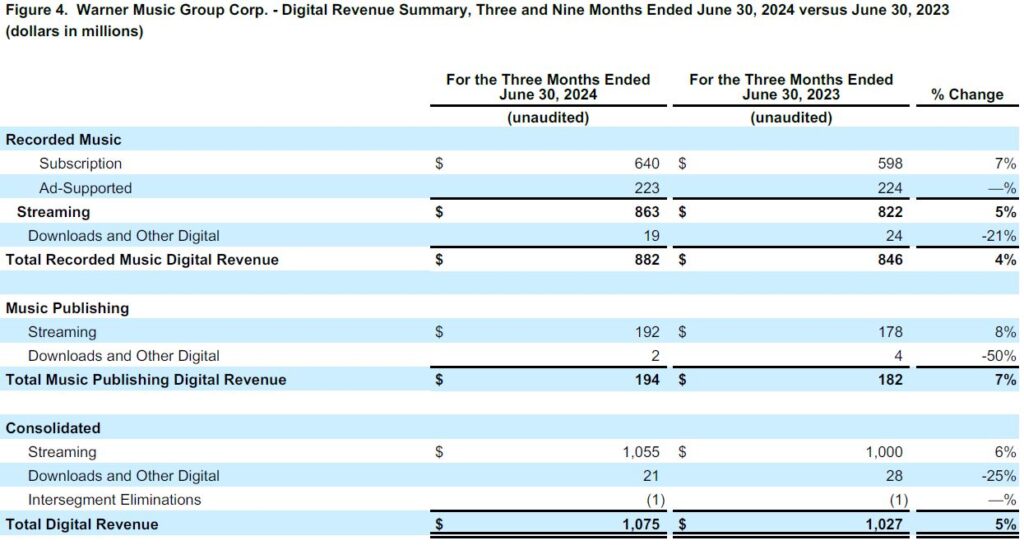
Digital revenue increased 4.7% (or 5.9% in constant currency) and streaming revenue increased 5.5% (or 6.7% in constant currency). Recorded Music streaming revenue increased 5.0% (or 6.4% in constant currency); however, adjusted for the impact of the BMG Termination of $25 million and the Digital License Renewal of $3 million, Recorded Music streaming revenue was up 8.7% (or 10.2% in constant currency). Music Publishing streaming revenue increased 7.9% (the same in constant currency); however, adjusted for the impact of the CRB Rate Benefit of $7 million, Music Publishing streaming revenue was up 12.3% (the same in constant currency). Revenue increases in the quarter were also driven by growth in Music Publishing performance and synchronization revenue, partially offset by lower Recorded Music physical, licensing and artist services and expanded-rights revenue and Music Publishing mechanical revenue.
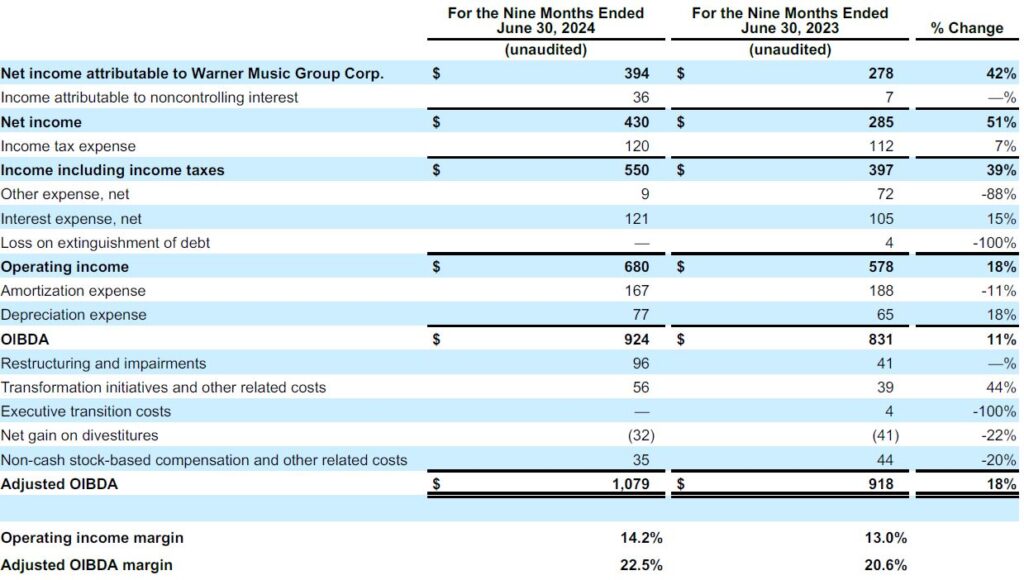
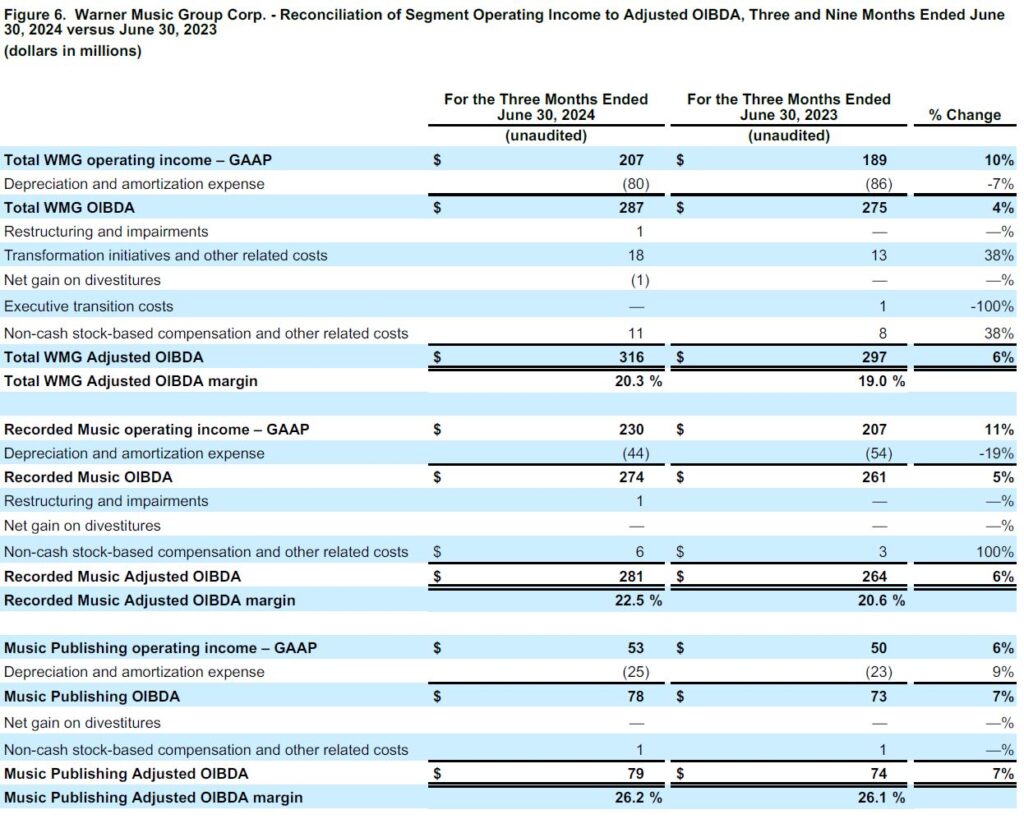
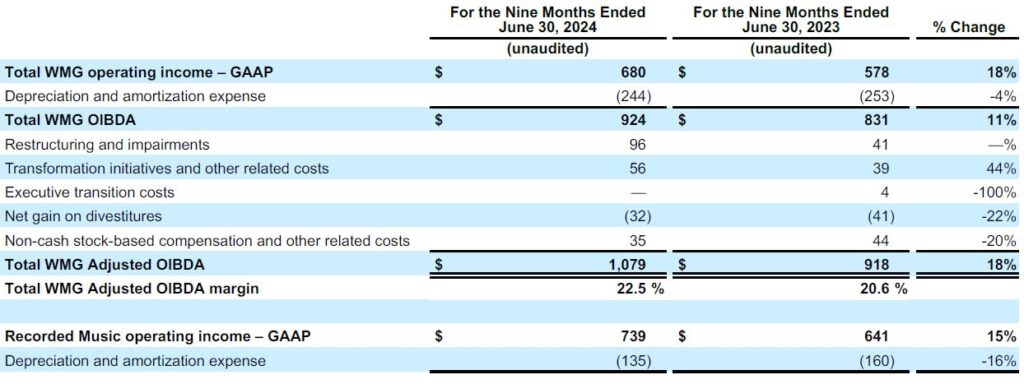
Operating income increased 9.5% (or 11.9% in constant currency) from $189 million to $207 million primarily due to the factors affecting Adjusted OIBDA discussed below, as well as a $9 million decrease in amortization expense due to certain intangible assets becoming fully amortized, and a $1 million net gain on a divestiture of certain non-core owned and operated media properties in the quarter, partially offset by $5 million of incremental expenses related to transformation initiatives and other related costs, and higher non-cash stock-based compensation of $3 million.
Adjusted OIBDA increased 6.4% from $297 million to $316 million (or 7.8% in constant currency) and Adjusted OIBDA margin increased 1.3 percentage points to 20.3% from 19.0% in the prior-year quarter (the same in constant currency).
The increases in Adjusted OIBDA and Adjusted OIBDA margin were driven primarily by strong operating performance, savings from the March 2023 restructuring plan (the “2023 Restructuring Plan”) and savings from the Strategic Restructuring Plan, of which a portion has been reinvested in the Company’s business.
Net income increased 13.7% from $124 million to $141 million. The increase in net income was primarily due to the factors described above, a loss on extinguishment of debt in the prior-year quarter, and lower income tax expense primarily due to a benefit in the quarter related to foreign derived income and the impact of exchange rates on the Company’s Euro-denominated debt resulting in a higher gain in the quarter compared to the prior-year quarter, partially offset by an increase in unrealized losses related to certain investments and an increase in interest expense, net, primarily due to increased costs on the Company’s variable rate debt.
Basic and Diluted earnings per share were $0.27 for both the Class A and Class B shareholders due to the net income attributable to the Company in the quarter of $141 million.
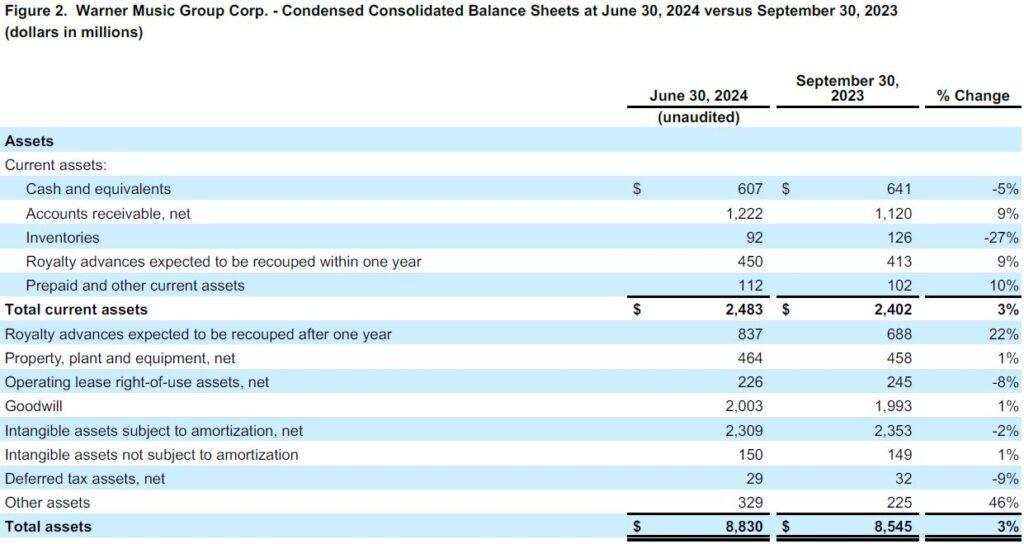
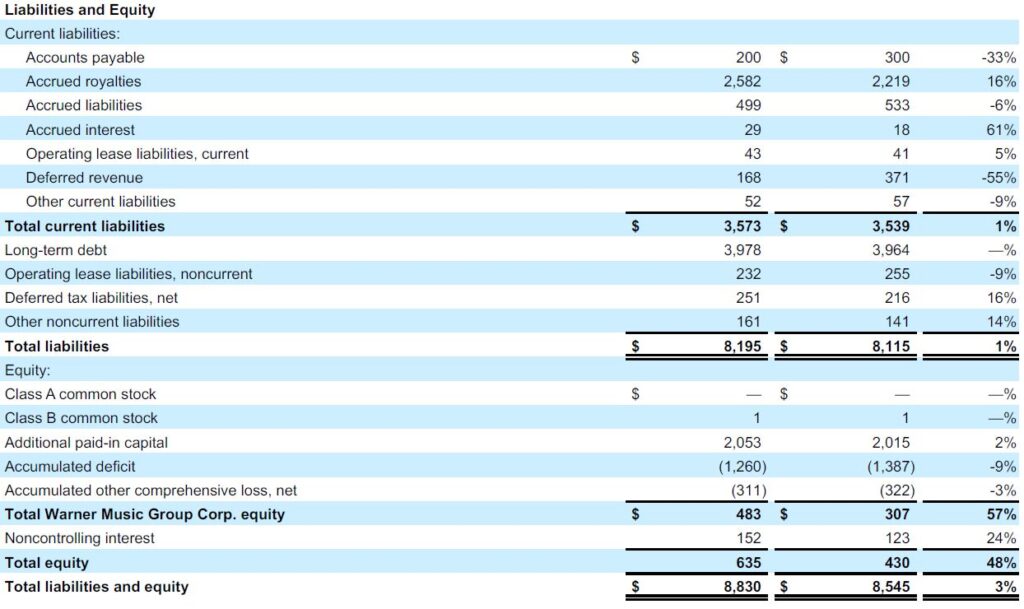
As of June 30, 2024, the Company reported a cash balance of $607 million, total debt of $3.978 billion and net debt (defined as total debt, net of deferred financing costs, premiums and discounts, minus cash and equivalents) of $3.371 billion.
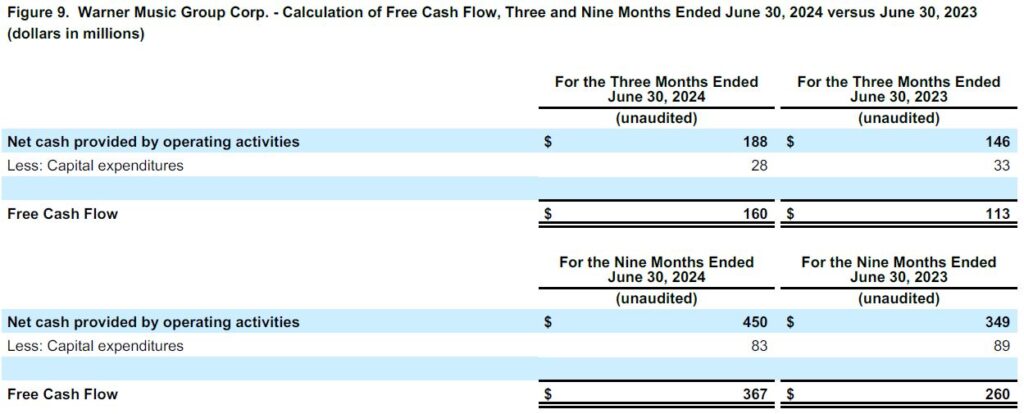
Cash provided by operating activities increased 29% to $188 million in the quarter compared to $146 million in the prior-year quarter. The increase was largely driven by strong operating performance and the timing of working capital. Capital expenditures decreased 15% to $28 million from $33 million in the prior-year quarter. Free Cash Flow, as defined below, increased 42% to $160 million from $113 million in the prior-year quarter, primarily due to the factors affecting cash provided by operating activities described above.
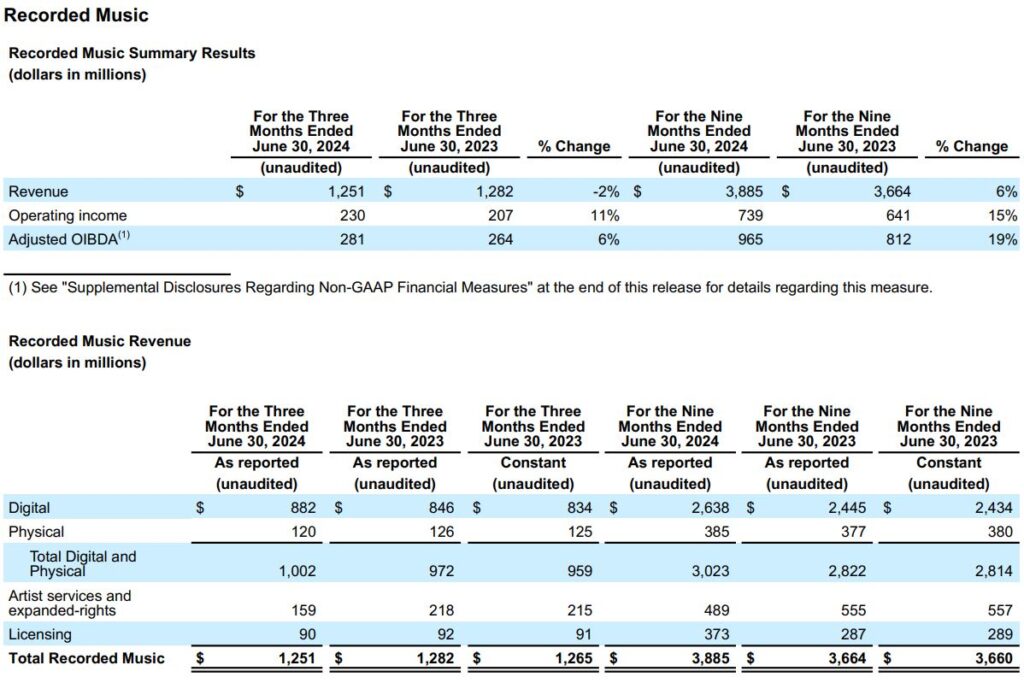
Recorded Music revenue was down 2.4% (or 1.1% in constant currency) driven by decreases in artist services and expanded-rights, physical and licensing revenue, partially offset by growth in digital revenue. Excluding the impact from the BMG Termination of $26 million and the Digital License Renewal of $3 million, Recorded Music revenue decreased 0.2% (or increased 1.2% in constant currency). Digital revenue was up 4.3% (or 5.8% in constant currency) and streaming revenue was up 5.0% (or 6.4% in constant currency). Adjusted for the impact of the BMG Termination of $25 million and the Digital License Renewal of $3 million, Recorded Music streaming revenue was up 8.7% (or 10.2% in constant currency). Streaming revenue reflects growth in subscription revenue of 7.0% (or 8.5% in constant currency), partially offset by a decline in ad-supported revenue of 0.4% (or growth of 0.9% in constant currency). Adjusted for the impact of the BMG Termination of $24 million and the Digital License Renewal of $3 million, subscription revenue increased 12.1% (or 13.7% in constant currency). Licensing revenue decreased 2.2% (or 1.1% in constant currency), driven by the timing of copyright infringement settlements. Physical revenue decreased 4.8% (or 4.0% in constant currency), primarily driven by timing of releases and strong U.S. releases in the prior-year quarter. Artist services and expanded-rights revenue decreased 27.1% (or 26.0% in constant currency) primarily due to lower merchandising revenue, lower concert promotion revenue primarily related to Japan and France, and a decrease in revenue related to the exit of the Company’s owned and operated media properties announced as part of the Strategic Restructuring Plan. Major sellers included Dua Lipa, Benson Boone, Zach Bryan, Teddy Swims, and Twenty One Pilots.
Recorded Music operating income was $230 million, an increase from $207 million in the prior-year quarter, and operating margin was up 2.3 percentage points to 18.4% versus 16.1% in the prior-year quarter. The increase in operating income was primarily due to the factors affecting Adjusted OIBDA discussed below, as well as an $11 million decrease in amortization expense compared to the prior-year quarter due to certain intangible assets becoming fully amortized.
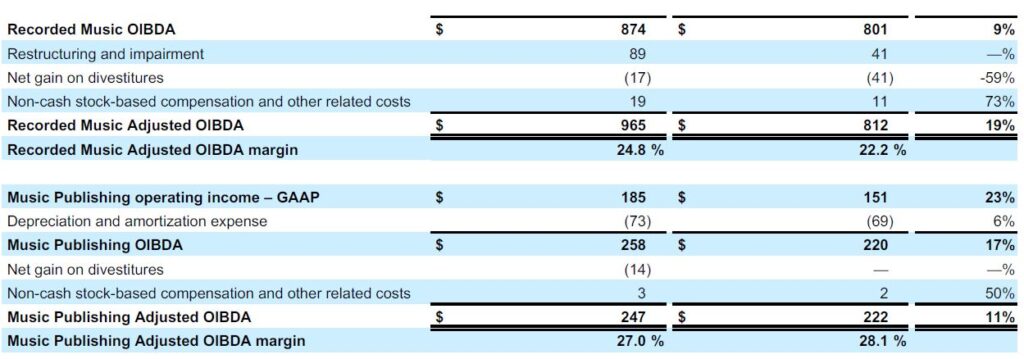
Adjusted OIBDA increased 6.4% to $281 million from $264 million (or 7.7% in constant currency) and Adjusted OIBDA margin increased 1.9 percentage points to 22.5% from 20.6% in the prior-year quarter (the same in constant currency). The increases in Adjusted OIBDA and Adjusted OIBDA margin were driven primarily by strong operating performance and savings from the 2023 Restructuring Plan and the Strategic Restructuring Plan, of which a portion has been reinvested in the Company’s business.
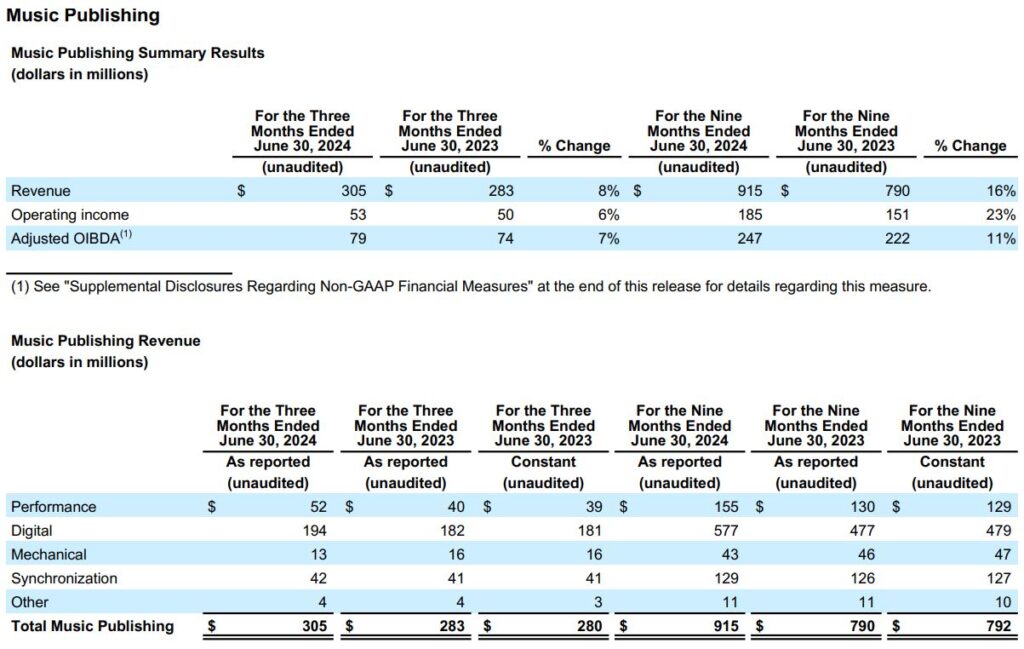
Music Publishing revenue increased 7.8% (or 8.9% in constant currency). Excluding the impact from the CRB Rate Benefit of $7 million, Music Publishing revenue increased 10.5% (or increased 11.7% in constant currency). The increase was driven by growth in digital, performance and synchronization revenue. Digital revenue increased 6.6% (or 7.2% in constant currency) and streaming revenue increased 7.9% (the same in constant currency). Excluding the CRB Rate Benefit in the prior-year quarter, Music Publishing digital revenue increased 10.9% (or 11.5% in constant currency) and streaming revenue increased 12.3% (the same in constant currency), reflecting continued market growth, expansion of our publishing catalog and timing of payments. Performance revenue increased 30.0% (or 33.3% in constant currency) due to an increase in touring activity outside the U.S. and U.S. radio activity. Mechanical revenue decreased $3 million or 18.8% (the same in constant currency), primarily driven by lower physical sales. Synchronization revenue grew 2.4% (the same in constant currency), driven by higher international commercial licensing activity, partially offset by the timing of copyright infringement settlements in the U.S.
Music Publishing operating income increased to $53 million compared to $50 million in the prior-year quarter and operating margin decreased 0.3 percentage points to 17.4%. The increase in operating income was primarily driven by the same factors affecting Adjusted OIBDA discussed below.
Music Publishing Adjusted OIBDA increased 6.8% to $79 million (or 8.2% in constant currency) driven by higher revenue and Adjusted OIBDA margin increased 0.1 percentage point to 26.2% from 26.1% in the prior-year quarter (the same in constant currency).
Financial details for the quarter can be found in the Company’s current Quarterly Report on Form 10-Q for the period ended June 30, 2024, which will be filed this morning with the Securities and Exchange Commission.
This morning management will be hosting a conference call to discuss the results at 8:30 A.M. EST. The call will be webcast on www.wmg.com.
About Warner Music Group
With a legacy extending back over 200 years, Warner Music Group today is home to an unparalleled family of creative artists, songwriters, and companies that are moving culture across the globe. At the core of WMG’s Recorded Music division are four of the most iconic companies in history: Atlantic, Elektra, Parlophone and Warner Records. They are joined by renowned labels such as TenThousand Projects, 300 Entertainment, Asylum, Big Beat, Canvasback, East West, Erato, FFRR, Fueled by Ramen, Nonesuch, Reprise, Rhino, Roadrunner, Sire, Spinnin’ Records, Warner Classics and Warner Music Nashville. Warner Chappell Music – which traces its origins back to the founding of Chappell & Company in 1811 – is one of the world’s leading music publishers, with a catalog of more than one million copyrights spanning every musical genre from the standards of the Great American Songbook to the biggest hits of the 21st century.
“Safe Harbor” Statement under Private Securities Litigation Reform Act of 1995
This communication includes forward-looking statements that reflect the current views of Warner Music Group about future events and financial performance. Words such as “estimates,” “expects,” “anticipates,” “projects,” “plans,” “intends,” “believes,” “forecasts” and variations of such words or similar expressions that predict or indicate future events or trends, or that do not relate to historical matters, identify forward-looking statements. All forward-looking statements are made as of today, and we disclaim any duty to update such statements. Our expectations, beliefs and projections are expressed in good faith and we believe there is a reasonable basis for them. However, we cannot assure you that management’s expectations, beliefs and projections will result or be achieved. Investors should not rely on forward-looking statements because they are subject to a variety of risks, uncertainties, and other factors that could cause actual results to differ materially from our expectations. Please refer to our Form 10-K, Form 10-Qs and our other filings with the U.S. Securities and Exchange Commission concerning factors that could cause actual results to differ materially from those described in our forward-looking statements.
We maintain an Internet site at www.wmg.com. We use our website as a channel of distribution for material company information. Financial and other material information regarding Warner Music Group is routinely posted on and accessible at http://investors.wmg.com. In addition, you may automatically receive email alerts and other information about Warner Music Group by enrolling your email address through the “email alerts” section at http://investors.wmg.com. Our website and the information posted on it or connected to it shall not be deemed to be incorporated by reference into this communication.

Supplemental Disclosures Regarding Non-GAAP Financial Measures
We evaluate our operating performance based on several factors, including the following non-GAAP financial measure:
Adjusted OIBDA
We evaluate our operating performance based on several factors, including our primary financial measure of operating income (loss) before non-cash depreciation of tangible assets and non-cash amortization of intangible assets adjusted to exclude the impact of non-cash stock-based compensation and other related expenses and certain items that affect comparability including but not limited to gains or losses on divestitures and expenses related to restructuring and transformation initiatives (“Adjusted OIBDA”). We consider Adjusted OIBDA to be an important indicator of the operational strengths and performance of our businesses. However, a limitation of the use of Adjusted OIBDA as a performance measure is that it does not reflect the periodic costs of certain capitalized tangible and intangible assets used in generating revenues in our businesses. Accordingly, Adjusted OIBDA should be considered in addition to, not as a substitute for, operating income (loss), net income (loss) attributable to Warner Music Group Corp. and other measures of financial performance reported in accordance with United States generally accepted accounting principles (“U.S. GAAP”). In addition, our definition of Adjusted OIBDA may differ from similarly titled measures used by other companies.
Constant Currency
As exchange rates are an important factor in understanding period-to-period comparisons, we believe the presentation of revenue and Adjusted OIBDA on a constant-currency basis in addition to reported results helps improve the ability to understand our operating results and evaluate our performance in comparison to prior periods. Constant-currency information compares revenue and Adjusted OIBDA between periods as if exchange rates had remained constant period over period. We use revenue and Adjusted OIBDA on a constant-currency basis as one measure to evaluate our performance. We calculate constant-currency by calculating prior-year revenue and Adjusted OIBDA using current-year foreign currency exchange rates. Revenue and Adjusted OIBDA on a constant-currency basis should be considered in addition to, not as a substitute for, revenue and Adjusted OIBDA reported in accordance with U.S. GAAP. Revenue and Adjusted OIBDA on a constant-currency basis, as we present them, may not be comparable to similarly titled measures used by other companies and are not a measure of performance presented in accordance with U.S. GAAP.


Free Cash Flow
Our definition of Free Cash Flow is defined as cash flow provided by operating activities less capital expenditures. We use Free Cash Flow, among other measures, to evaluate our operating performance. Management believes Free Cash Flow provides investors with an important perspective on the cash available to fund our debt service requirements, ongoing working capital requirements, capital expenditure requirements, strategic acquisitions and investments, and any dividends, prepayments of debt or repurchases or retirement of our outstanding debt or notes in open market purchases, privately negotiated purchases, any repurchases of our common stock or otherwise. As a result, Free Cash Flow is a significant measure of our ability to generate long-term value. It is useful for investors to know whether this ability is being enhanced or degraded as a result of our operating performance. We believe the presentation of Free Cash Flow is relevant and useful for investors because it allows investors to view performance in a manner similar to the method management uses.
Free Cash Flow is not a measure of performance calculated in accordance with U.S. GAAP and therefore it should not be considered in isolation of, or as a substitute for, net income (loss) as an indicator of operating performance or cash flow provided by operating activities as a measure of liquidity. Free Cash Flow, as we calculate it, may not be comparable to similarly titled measures employed by other companies. In addition, Free Cash Flow does not necessarily represent funds available for discretionary use and is not necessarily a measure of our ability to fund our cash needs. Because Free Cash Flow deducts capital expenditures from “net cash provided by operating activities” (the most directly comparable U.S. GAAP financial measure), users of this information should consider the types of events and transactions that are not reflected. We provide below a reconciliation of Free Cash Flow to the most directly comparable amount reported under U.S. GAAP, which is “net cash provided by operating activities.”